
Fourier analysis is a great tool for spectral analysis but when it comes
to stock market cycles I prefer to complete it with additional tools
following a non standard quantitative approach to cycles theory: rather
than extracting evanescent series of sine waves form a given time series
of price I look with Fouriers Analysis and other signal analysis tools
for dominant periodicity in the financial time series with frequency
being an harmonic of the most important cycles operating in nature and
in the sky assuming that all things on Earth, including stock prices
respond to these cycles in the same way tides,
plants, animals and humans do. Astronomical cycles always
repeat themselves and human history always repeats itself: when I find
traces of astronomical influence in the spectrum of a stock price I use
its respective astronomical cycles for improve my forecasts.
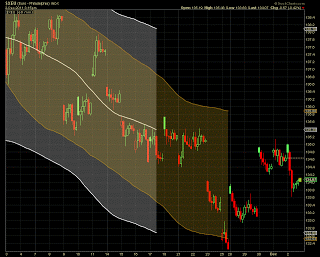
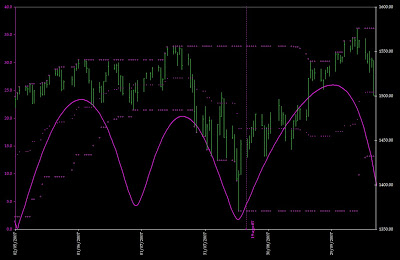
The easiest frequency filter for financial time series is the simple moving average: it can be used to filter lower order cycles from the astronomical cycle we want to track, their bands can be used to better visualize the cycle boundaries and improve our ability to perceive the rhythm of the cycle on the stock chart. Centering these moving averages and their bands (plotting them properly at a time equals to half their span) reminds us of their lagging characteristic helping us to focus on the future rather than on the past (see chart below).
The easiest frequency filter for financial time series is the simple moving average: it can be used to filter lower order cycles from the astronomical cycle we want to track, their bands can be used to better visualize the cycle boundaries and improve our ability to perceive the rhythm of the cycle on the stock chart. Centering these moving averages and their bands (plotting them properly at a time equals to half their span) reminds us of their lagging characteristic helping us to focus on the future rather than on the past (see chart below).

Mars Cycle Cycle (26 months) with a 26 months simple moving average (properly plotted): observe the lag (in this case a 13 months) that a trader faces using a simple moving average
Many traders look at their stock charts with their lagging indicators
and averages as if those were capable of providing them with information
on future events but that is just like driving with booth eyes looking
in the rear mirror. How can we deal with the lag of a smoother like a
simple moving average? Alternatives to moving average do exists:
spectral analysis, statistics and calculus provide traders with better
tools to improve the quality of their smoother: below I will show you
how a complex numerical filter can be used to plot the same bands the we
showed above (the Mars centered moving average bands) up to the current
date:

Mercury Cycle using a complex numerical filter that is intended to "fill" the 13 moths gap of the simple moving average

Mercury Cycle (+/- 16 weeks) with a 16 weeks simple moving average (properly plotted): observe the lag (in this case a 8 weeks) that a trader faces using a simple moving average

Another source of information and practical examples of astronomy applied to the Hurst Cycles approach is my own blow Wall Street Watchman.
Using cutting edge quantitative models improves the trader's knowledge of the past and the trader's ability to describe the present but still it does not tell anything about the future. What makes a cycle turn or accelerate? What is the hidden force that suddenly change the slope of a smoother? It's new prices or simply the future: and I do not know a model that deals satisfactory with forecasting the future....this is why I have turned my attention to astronomy.
Astronomy provides us with the information about the potential pivot dates when cycles may turn helping us to focus on the future: in my analysis past information extracted from prices is used to describe and visualize the cycle while the astronomical phenomena related to the tracked cycle are used to improve timing of its potential cyclical turns.
The natural and hierarchic order of cycles is also taken into
account: a weekly cycle is observed inside the monthly lunar cycle, the
lunar cycle is observed inside a three month cycle which is observed
inside an annual solar cycle and so on ...natural, immutable
astronomical cycles are used, not artificial best fitting cycles that
are temporary in nature.
Geometry and Trigonometry and the laws of the circle division are used to find the prices which are good candidates to show up at critical turn dates.
Geometry and Trigonometry and the laws of the circle division are used to find the prices which are good candidates to show up at critical turn dates.
Some of my charts are visible in a public chart list (the
lagging ones using moving averages because no public charting service
offers the custom filters that I use to improve my cycle analysis) ,
many of my forecasts are
public as well, in my blog I post my comments about the markets
on a daily basis and from time to time I make reference to potential
turn dates derived from my work on cycles.
I
have no secrets or an "holy grail" solution for forecasting most of the
things I know I published on my books: I believe good teachings will
reach only the good people and they will be ignored by the others.
My First Book: Wall Street Watchman
My thematic website dedicated to astrotrading: Astro-Trading.Net
My blog about the markets: Wall Street Watchman
Below you can find a couple of examples of my techniques:
1-Lunar Cycle Bands for Intraday Eur/USD forecasting
2- Mercury Synodic Cycle as forecasting tool (for daily charts) : in this case no parametric models are used, just plain astronomical cycles to predict the future something that the most advanced quantitative models cannot do.
1-Lunar Cycle Bands for Intraday Eur/USD forecasting

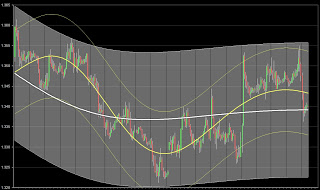
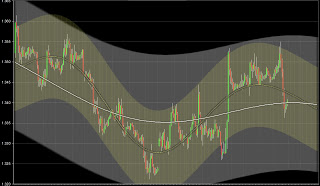
Moon Cycle Example with lagging averages (above) and my numerical lunar filter that is intended to "fill" the 1 week gap of the simple moving average

My numerical lunar filter (above) and my numerical lunar filter plus forecast (below)

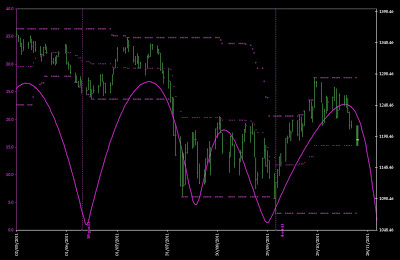
2- Mercury Synodic Cycle as forecasting tool (for daily charts)

Mercury astronomical cycle as forecasting tool example

Mercury astronomical cycle as forecasting tool example
Wave59 is a powerful software that helps traders to draw and use astronomic tools in their charts.